

Wearable Lactate Training Load Metrics Interpretation

Why lactate training load metrics need interpretation

Wearable lactate training load metrics promise a more direct link between training and physiology than heart rate alone. Many systems estimate training stress by modeling lactate dynamics (or lactate-related proxies) from signals such as heart rate, pace/power, cadence, and sometimes blood-lactate calibration data. The result is a set of “load” numbers that can be tracked across sessions and over time.
However, lactate is not a single, universal number. It reflects a balance between production and clearance that depends on intensity, duration, muscle groups, training status, and even measurement conditions. That means the best way to use wearable lactate load metrics is to interpret them as model outputs—useful trends that still require context.
This guide explains how to read lactate training load metrics, what the common components usually represent, why estimates can drift, and how to translate metrics into practical training actions.
What “lactate training load” usually represents in wearables
Most wearable systems do not directly measure blood lactate in real time. Instead, they estimate lactate-related stress using a physiological model. In practice, the metrics you see are designed to answer: “How much metabolic strain did this session likely impose?”
Depending on the platform, the metric may be called lactate load, lactate threshold load, aerobic/anaerobic contribution, or similar. The underlying idea is consistent:
- Higher intensity sessions tend to push lactate production upward and reduce the time available for clearance.
- Longer duration sessions accumulate metabolic stress even if peak intensity is moderate.
- Individual fitness changes how quickly you reach given metabolic states, so the same pace/power can represent different lactate dynamics over weeks.
Interpretation starts with recognizing that the metric is typically a composite of intensity distribution (how hard you were over time) and duration (how long you sustained those intensities). Two workouts with the same average heart rate or average power can still produce different lactate load profiles if one includes more time near high-intensity domains.
Breaking down common lactate load components
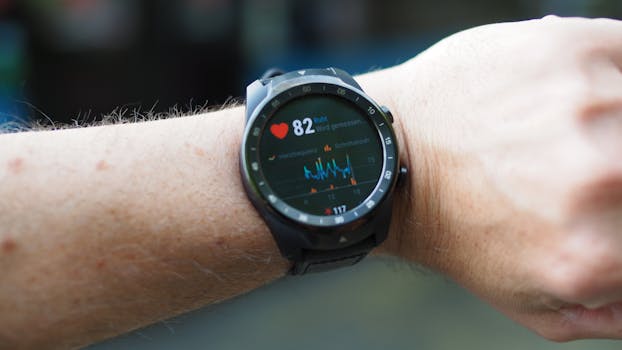
Wearables vary, but interpretation is easier when you know what the numbers are trying to capture. Common components include:
Total lactate training load
This is usually a session-level summary of overall metabolic stress. It tends to rise with harder efforts, longer durations, and workouts that include repeated high-intensity intervals.
Practical interpretation: Use it to compare sessions within the same device and settings. Absolute values across different brands or models are often not interchangeable because the underlying algorithms and scaling differ.
Many systems separate stress into bands relative to an estimated threshold (often tied to lactate threshold concepts). The “threshold” in wearables is frequently derived from training history, test results, or model fitting rather than direct lab measurement.
Practical interpretation: If your high/above-threshold load is disproportionately high, the workout likely contained substantial time near or above the intensity where lactate begins to accumulate faster than it can be cleared. That usually correlates with higher neuromuscular and recovery demands than purely aerobic sessions.
Some platforms allocate load to a lower-intensity domain. Even when lactate levels are not “high” in the lab sense, metabolic stress still accumulates due to sustained glycolytic contribution, muscle work, and cardiovascular strain.
Practical interpretation: Aerobic load can be particularly useful for planning volume. If total load is rising mostly due to aerobic components, you may be building endurance with less acute stress than workouts driven by high-intensity bands.
Some wearables provide breakdowns showing how much load came from intervals or from time spent in specific intensity zones. Even when you do not see explicit “zones,” the session graph often reveals whether load was driven by a few peaks or by sustained work.
Practical interpretation: A workout with many short hard bouts can show high peak stress while the total load might remain moderate if the recovery between bouts is sufficient. Conversely, a steady threshold workout can produce a large total load with less pronounced peaks.
How wearable algorithms estimate lactate without blood tests
The core challenge is that lactate in blood is not measured directly. Instead, wearables estimate lactate dynamics from other observable signals. Common inputs include:
- Heart rate (with attention to drift and individual heart rate response)
- Power or pace (for cycling/running/rowing)
- Cadence/stride rate (sometimes used to infer efficiency and muscle recruitment)
- Training history (to infer personal thresholds and adaptation)
Most models assume that as intensity rises, lactate production increases and clearance capacity becomes insufficient to keep up. Over a session, the model tries to map your intensity exposure to likely lactate accumulation patterns, then converts that into a “load” number.
Key implication: If your heart rate is affected by factors unrelated to metabolic stress—heat, dehydration, caffeine, stress, altitude, illness, or poor sleep—the lactate load estimate can shift even if your mechanical output is similar.
Interpreting trends: session-to-session vs week-to-week
One of the most useful ways to interpret wearable lactate load metrics is to focus on trends rather than single-session values. A single-day outlier can occur for many reasons.
Over several weeks, you’ll usually see that your “normal” session types produce repeatable ranges of lactate load. For example, a typical tempo run at your usual pace might consistently land in a similar load band.
Practical interpretation: When the same workout produces a meaningfully higher load than usual, it may indicate reduced readiness, higher physiological strain from heat or fatigue, or a threshold estimate that has shifted.
Sudden changes can be informative, but they require confirmation. For example, after a hard block, your lactate load for a familiar interval workout may rise because your body is less able to clear lactate efficiently at the same output.
Practical interpretation: If load increases while performance (pace/power) drops or perceived effort rises, that’s a strong signal to adjust training intensity or reduce total stress.
Lactate load tells you about metabolic stress; it does not directly measure muscle damage, tendon strain, or readiness. Combine lactate load interpretation with other cues such as sleep quality, resting heart rate trends, perceived soreness, and training consistency.
Heart rate-based estimation is vulnerable to drift. In heat or humidity, heart rate can climb even if pace/power is stable. That can lead to inflated lactate load estimates.
Mitigation: Compare sessions performed under similar conditions when possible. If you’re training in heat, interpret lactate load as “higher than expected stress,” not necessarily as a precise lactate measure.
Threshold-related metrics depend on an estimated threshold intensity. If the wearable’s threshold model is outdated or was incorrectly set due to limited data, the split between “aerobic” and “high” load can be misleading.
Mitigation: Re-check your threshold settings after a period of consistent training or after a key test. Also, look for convergence: if the model says you’re “above threshold” but your perceived effort suggests otherwise, treat the threshold estimate cautiously.
Because algorithms and scaling differ, lactate load numbers are not always comparable across brands. Even within the same brand, changing sensor setup (new strap, different watch model, different sampling rate) can alter outputs.
Mitigation: Keep sensor and settings consistent. Interpret absolute numbers within the same system, and use cross-system comparisons only for rough context.
High lactate load can be intentional. Interval sessions, race simulations, and threshold workouts are meant to accumulate stress. The risk is turning a single metric spike into an immediate reduction every time.
Mitigation: Evaluate whether the session fits your plan and how your next 24–72 hours respond. If you recover well and performance returns, the load was likely appropriate.
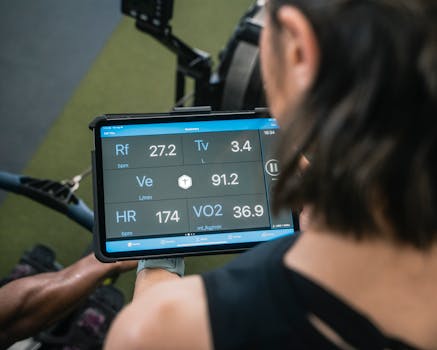
Once you can interpret the metrics reliably, the main question becomes: “How do I use this information to guide training structure?”
Instead of only tracking total load, pay attention to which component dominates:
- If high/above-threshold load is large, the session likely required a greater fraction of glycolytic effort and will usually demand more recovery.
- If aerobic load dominates, you can often accumulate volume more frequently, assuming other stressors (sleep, soreness) are managed.
Practical guidance: For endurance build phases, increase aerobic load gradually while keeping high-threshold sessions less frequent. For sharpening phases, allow high-threshold load to rise but reduce aerobic volume enough to prevent excessive total stress.
Two athletes can do the same interval session, but their optimal frequency differs based on recovery capacity. Lactate load helps estimate how often you can repeat hard work.
Practical guidance: If your lactate load remains high for consecutive hard sessions and performance is slipping, increase recovery time or insert an easier aerobic day. If load drops quickly and performance remains stable, you may be able to maintain frequency.
You don’t need complex formulas. A practical approach is to combine lactate load with readiness:
- If lactate load is higher than your recent average for that workout type and performance or perceived effort worsens, reduce intensity or shorten the session.
- If lactate load is similar to your baseline and recovery signals look good, keep the plan and focus on consistency.
- If lactate load is lower than expected but you feel great, it may be an opportunity to progress—provided you still respect overall weekly stress.
These rules work because lactate load is most useful as a relative indicator of metabolic stress rather than a perfect measure of “true lactate.”
Wearable lactate load metrics are one part of a broader performance ecosystem. Many athletes also use:
- Power/pace targets derived from thresholds or testing
- Training load models based on heart rate variability, session RPE, or time-in-zone
- Recovery metrics such as sleep staging or resting heart rate
The most effective interpretation strategy is to treat lactate load as the metabolic-stress lens, while using other metrics to cover areas lactate models may not capture (neuromuscular fatigue, tendon load, and general readiness).
For example, if lactate load is moderate but your legs feel heavy and sleep has been poor, the limiting factor may be recovery rather than lactate accumulation. Conversely, if lactate load is high but you feel fresh, you may still need to consider long-term planning—high lactate exposure can accumulate even when you feel okay at first.
Practical examples of interpretation
You run a tempo workout at a familiar pace. The lactate threshold related load is higher than usual. Even if the pace is similar, the body may be producing more metabolic stress due to fatigue, heat, or altered threshold estimation.
Actionable interpretation: Keep the next day easier. Consider reducing the intensity of the next threshold session or shortening it.
Short intervals produce high peak intensity, but recovery between reps prevents sustained high-intensity exposure. Total lactate load may remain within your expected range.
Actionable interpretation: This pattern can be a good way to stimulate intensity without excessive overall metabolic stress. Still, monitor soreness and performance in subsequent days.
If your threshold workout now spends more time in the high/above-threshold band and total load rises, the session is likely more taxing than before.
Actionable interpretation: Confirm whether your threshold model has shifted. If it hasn’t, treat the increased load as a readiness signal and adjust volume or intensity.
Summary and prevention guidance
Wearable lactate training load metrics interpretation works best when you treat the numbers as estimated metabolic stress, not direct blood-lactate measurements. Focus on how metrics change over time for your typical workout types, and interpret session totals together with threshold-related components.
To avoid common errors:
- Use consistent sensors and settings, and avoid comparing absolute values across devices.
- Account for heart rate drift from heat, hydration issues, and stress.
- Be cautious when threshold-related splits appear inconsistent with how the workout felt.
- Use recovery signals and performance trends to decide whether a high-load session was appropriate or excessive.
When interpreted this way, lactate training load metrics can add a physiologically grounded layer to training decisions—helping you structure intensity, manage frequency, and reduce the guesswork that comes from relying on a single metric.
23.12.2025. 02:23