

SpO2 vs ODI Interpretation: How to Read Oxygen and Desaturation Data

SpO2 and ODI are two common metrics used to describe oxygen status during sleep or respiratory events. SpO2 reflects oxygen saturation at a moment in time, while ODI (oxygen desaturation index) summarizes how often oxygen drops to clinically meaningful levels. Because both numbers can be influenced by sensor quality, breathing patterns, and device settings, interpretation requires more than reading a single value. This FAQ hub focuses on practical, educational guidance for understanding SpO2 vs ODI interpretation in real-world monitoring.
What does SpO2 measure in a pulse oximeter?
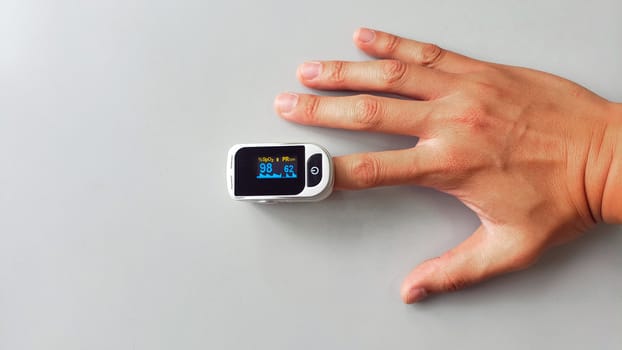
SpO2 (oxygen saturation) estimates the percentage of hemoglobin carrying oxygen in arterial blood. A pulse oximeter uses light absorption through the skin to infer saturation continuously. Clinically, SpO2 is often used to identify hypoxemia (low oxygen) and to track trends over time.
SpO2 values are typically reported as a percentage (for example, 94%). Many systems also show a baseline trend and the lowest recorded saturation (often called nadir). Interpretation depends on the measurement quality and the context of breathing events.
What does ODI mean, and how is it calculated?
ODI (oxygen desaturation index) counts the number of times oxygen saturation drops by a defined amount within a defined time window. The most common definition uses a drop of 3% or 4% from a baseline saturation, but exact thresholds vary by device and clinical protocol.
In practice, ODI is expressed as events per hour (ODI per hour). For example, ODI4 means desaturations of at least 4 percentage points. Some reports use ODI3 or ODI5 depending on the system settings.
Because ODI is event-based, it can rise even when average SpO2 looks acceptable, especially if desaturations are frequent but brief.
How should I interpret a low minimum SpO2 value?
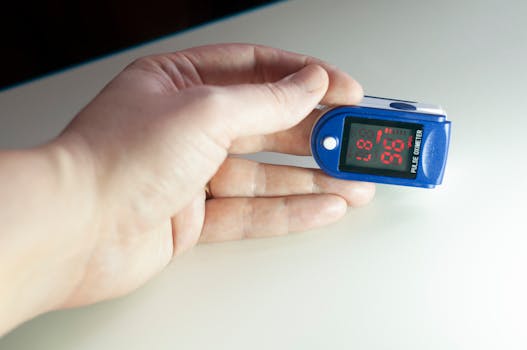
A single low SpO2 reading (the nadir) can be clinically important, but it must be interpreted carefully. One brief dip may be related to motion artifact, poor sensor contact, or transient events such as coughing. A sustained low level is more concerning than a short-lived drop.
When available, look for the duration of the low saturation and whether the dip clusters around respiratory events (for example, apneas or hypopneas). If the lowest value occurs repeatedly and is accompanied by symptoms or other abnormal respiratory metrics, it is more likely to reflect true oxygen impairment.
If your device report provides time-in-range or trend plots, those are often more informative than the single lowest number.
What ODI thresholds are commonly considered abnormal?
Common sleep-related interpretations often categorize ODI based on severity of oxygen desaturation frequency. While exact cutoffs differ across guidelines and studies, many clinicians use ranges such as:
- Mild: lower ODI values (often around the teens per hour or less, depending on definition)
- Moderate: intermediate ODI values
- Severe: higher ODI values (often well above 30 events/hour in many practical systems)
Because ODI definition (3% vs 4%) and patient population affect thresholds, the most reliable approach is to interpret ODI in the context of the report’s definition and the clinical evaluation that accompanies it.
If your ODI is elevated, it usually warrants review of the corresponding breathing event pattern and oxygen trend rather than relying on ODI alone.
Why can SpO2 look “okay” while ODI is high?
This situation is common. SpO2 often reflects an overall level or trend, while ODI counts discrete drops. If oxygen saturation returns quickly between events, average or baseline SpO2 can remain relatively normal even though desaturations occur frequently.
For example, a person may maintain a baseline saturation around the mid-90s but experience repeated drops of 3–4 percentage points during sleep-disordered breathing. Those frequent dips raise ODI while not necessarily lowering the average saturation dramatically.
That pattern suggests repeated transient oxygen stress, which may still have clinical significance, particularly if it correlates with apnea or hypopnea events.
Why can ODI be low even if SpO2 drops intermittently?
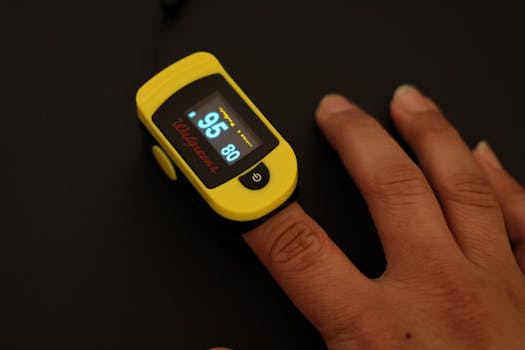
ODI depends on how desaturation is defined and counted. If drops are small (below the device’s threshold), brief (shorter than the time window), or not detected due to sensor limitations, ODI may remain low despite intermittent SpO2 dips.
Another reason is that some reports emphasize ODI events only when they meet a minimum duration or recovery pattern. If saturation falls but does not meet the required criteria, it might not be counted as a desaturation event.
To interpret this correctly, check the report for the ODI definition (for example, ODI4) and consider reviewing the saturation waveform or event timeline if available.
How do sensor artifacts affect SpO2 vs ODI interpretation?
Pulse oximetry is sensitive to motion, poor circulation, ambient light, cold extremities, and loose sensor placement. Artifacts can cause false low readings or irregular signals.
SpO2 is affected by artifacts directly because it is continuous. ODI can also be affected because false dips can be counted as desaturation events, especially when the device misinterprets signal noise as true oxygen drops.
Look for quality indicators in the report (if provided). If the device flags poor signal quality or if desaturation events occur during periods of movement, talking, or mask adjustments, sensor artifact becomes more likely.
Consistent, event-linked desaturations that align with breathing patterns are less likely to be artifacts.
What role does the ODI definition (3% vs 4%) play?
The ODI definition determines which drops are counted. ODI4 generally requires a larger drop than ODI3, so ODI4 may be lower for the same underlying physiology. Conversely, ODI3 may be higher because smaller drops qualify.
When comparing results across reports or studies, it is essential to use the same definition. Otherwise, differences may reflect counting rules rather than true changes in oxygen physiology.
Within a single report, the ODI definition also influences clinical interpretation. If your report uses ODI4, then a “normal” ODI4 does not automatically mean there were no smaller desaturations; it means the drops did not meet that threshold.
How do baseline saturation and recovery time influence ODI?
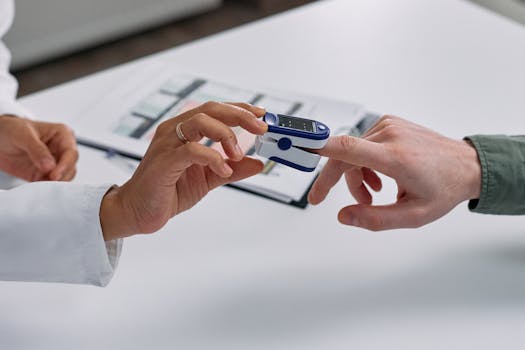
ODI counts the frequency of drops relative to a baseline. If a person’s baseline saturation is already lower, a small change may or may not meet the threshold depending on how the baseline is established by the device.
Recovery time matters as well. If saturation drops and returns quickly, it may still count as an event if it meets the criteria. If the device’s time window groups events closely, rapid repeated dips may be counted as multiple events or merged into fewer events based on the algorithm.
Therefore, two people with similar average SpO2 could have different ODI values due to differences in baseline stability and recovery dynamics.
How can I interpret SpO2 patterns during sleep stages or wakefulness?
Oxygen saturation can vary naturally across sleep stages and body positions. REM sleep may be associated with more respiratory variability for some individuals. Supine position can worsen breathing for others, leading to more frequent desaturations.
When reports include time-by-stage or position estimates, examine whether desaturations cluster in specific segments. If desaturations occur predominantly during sleep rather than wakefulness, that supports sleep-disordered physiology rather than generalized low oxygen.
If the device captures position or sleep stage, correlating oxygen dips with those contexts can improve interpretation beyond looking at overall averages.
How do CO2 retention and ventilation issues affect SpO2 vs ODI?
SpO2 and ODI primarily reflect oxygen saturation, not carbon dioxide levels. In some respiratory conditions—particularly those involving hypoventilation—CO2 can rise before oxygen saturation falls. This means SpO2 may remain relatively preserved while ventilation worsens.
As a result, ODI may not fully capture the severity of ventilatory impairment if oxygen drops are delayed or modest. Conversely, in conditions where oxygenation is affected, ODI may show frequent desaturations even if CO2 is not measured.
For comprehensive assessment, clinicians often consider arterial blood gases, transcutaneous CO2, or capnography when hypoventilation is suspected. Oxygen metrics alone may miss that aspect.
Can medications or altitude change how I interpret these metrics?

Yes. Medications that affect breathing drive, airway tone, or sleep architecture can influence both desaturation frequency and oxygen saturation patterns. Sedatives and certain pain medications may worsen upper airway collapsibility or reduce ventilatory responsiveness.
Altitude can also lower baseline oxygenation. At higher elevations, baseline SpO2 may be lower and desaturations may occur more often, raising ODI even if the underlying sleep-disordered breathing pattern is unchanged.
If the monitoring occurred during travel or at a different altitude than usual, interpretation should account for those conditions.
What should I do if the report shows frequent desaturations but few breathing events?
When oxygen dips occur without a corresponding pattern of apneas or hypopneas, several possibilities should be considered. These include:
- Signal quality problems causing false desaturations
- Alternative respiratory events not captured by the device’s event detection algorithm
- Periodic breathing or other ventilatory patterns that may not be labeled as apneas/hypopneas
- Position-related changes or upper airway variability that triggers oxygen drops without clear event labeling
To interpret this pattern, review the timeline: are the desaturations clustered with specific moments (movement, talking, mask adjustment), or are they evenly distributed across sleep? If possible, cross-check with other metrics in the report such as airflow limitation, respiratory effort, or waveform quality.
Persistent unexplained desaturations may require clinical evaluation and potentially additional testing.
How do I interpret SpO2 vs ODI when using home sleep monitoring devices?
Home devices can provide useful oxygen data, but their accuracy depends on sensor placement, signal quality, and the device’s detection algorithms. Many systems estimate SpO2 and compute ODI based on proprietary processing.
For interpretation:
- Confirm the ODI definition used in the report (ODI3 vs ODI4, event window settings if listed).
- Check for signal quality indicators or notes about poor readings.
- Look at the oxygen trend and the distribution of events across the night.
- Correlate desaturation timing with respiratory event markers if the device provides them.
Some reports also display oxygen saturation time below thresholds (for example, time under 90%). If provided, time-under-threshold can add context for how prolonged oxygen impairment is, complementing ODI.
How do I know when oxygen metrics need urgent clinical attention?
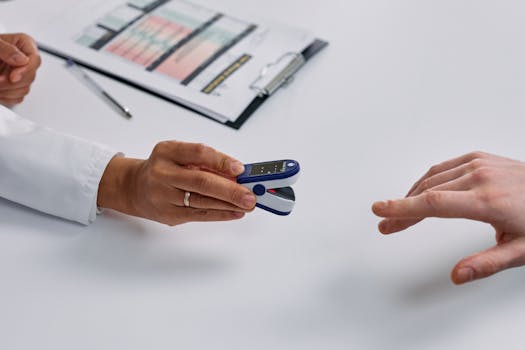
Oxygen metrics can signal urgent issues in certain circumstances, especially when very low saturations occur or symptoms are significant. While thresholds depend on the clinical situation, red flags often include:
- Repeated or sustained very low SpO2 values
- ODI that is high alongside severe symptoms (such as marked shortness of breath, confusion, chest pain, or cyanosis)
- SpO2 drops that occur frequently with no clear artifact explanation
- Known respiratory disease with worsening oxygenation trends
If you have severe symptoms, or if a clinician has told you to monitor oxygen and follow a specific action plan, follow that guidance. Otherwise, treat concerning oxygen patterns as a prompt for medical review rather than self-adjusting treatment based solely on device numbers.
What complementary data should I look at alongside SpO2 and ODI?
SpO2 and ODI are most informative when interpreted with additional measurements. Depending on the monitoring system, consider:
- Respiratory event indices (apnea-hypopnea index, event counts)
- Airflow or flow limitation signals if available
- Sleep time and body position (supine vs non-supine)
- Time spent below key saturation thresholds (when provided)
- Respiratory rate and waveform quality
For example, ODI that tracks closely with apnea/hypopnea events strengthens the interpretation that desaturations result from sleep-disordered breathing. ODI that does not correlate may point toward sensor issues or different physiology.
How should I interpret SpO2 and ODI in children versus adults?
Interpretation differs because pediatric oxygen physiology, normal ranges, and event definitions can vary. Children may experience different breathing patterns and may be more sensitive to airway obstruction.
ODI thresholds and severity categories used in adult sleep medicine may not directly apply to children. Additionally, sensor size and placement are critical; a poor fit can increase artifact and distort both SpO2 and ODI.
If monitoring is for a child, use pediatric-specific guidance from the ordering clinician or the device documentation, and interpret the results in the context of symptoms and clinical exam.
Do different devices report SpO2 vs ODI in consistent ways?
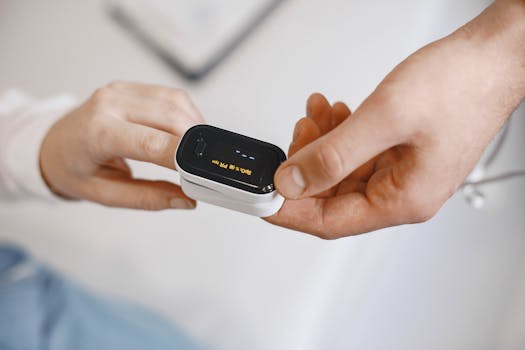
No. While the underlying concepts are similar, algorithms differ across manufacturers. Differences can include:
- Signal filtering and motion artifact handling
- How baseline is defined for desaturation counting
- ODI event window rules and threshold rounding
- How the device handles brief dips and clustering
Therefore, it is best to interpret results within the same device and settings when tracking trends over time. If you must compare across devices, focus on the report’s stated ODI definition and any oxygen time-below metrics that may be measured more consistently.
Can I use SpO2 and ODI to judge how well treatment is working?
Often, oxygen metrics can help evaluate treatment response, especially when they align with improved breathing event indices. For example, effective therapy for sleep-disordered breathing typically reduces the frequency of desaturations, lowering ODI and improving oxygen stability.
However, oxygen metrics should not be interpreted in isolation. Improvements in ODI may occur even if symptoms do not fully resolve, and symptoms may improve even if ODI changes modestly due to differences in sensitivity or baseline saturation.
When assessing response, compare consistent metrics across time using the same monitoring setup, and interpret changes alongside adherence data and other respiratory measurements.
Summary: What’s the practical way to interpret SpO2 vs ODI?
SpO2 shows the oxygen saturation level over time, while ODI summarizes how frequently oxygen drops meet a defined threshold. In SpO2 vs ODI interpretation, the most useful approach is to consider sensor quality, the ODI definition (such as 3% or 4% drops), the oxygen trend and duration of lows, and how desaturations align with breathing events and sleep context. When oxygen patterns are concerning or unexplained, clinical review and potentially additional testing provide the most reliable next step.
01.05.2026. 06:19